Getting started with Kelloo
CHAPTER 5
Views and reports
Things never look the same from different angles. So to help you gain perspective on your projects, resources and capacity try some of the different views and analysis in Kelloo.
In this guide we use the terminology projects to keep things simple. But you can use Kelloo to plan and schedule projects, products, agile sprints, service engagements or anything else. You can also customize the terminology and structure in Kelloo to match the language and workflow your team uses.
Section Overview
In this section you will learn about:
- Demand vs capacity reporting
- Using the utilization heatmap
- The Kelloo report builder
Demand vs capacity charts
Demand vs capacity is a metric that compares your organization’s total labor capacity (also known as labor supply) against all the work you need to do such as current projects, pipeline projects, un-approved projects and normal business activities (also known as demand).
While utilization is a metric to ensure your people are not overloaded. Demand vs capacity checks if your organization is overloaded. A good place to analyze this is using the utilization views.

Capacity levels are indicated in green. Demand is indicated using vertical bars. Demand bars higher than capacity mean demand exceeds capacity for the month.
You can use filters to analyze the capacity vs demand of different teams, roles and projects.

Pro tip
The utilization and capacity metrics help solve different problems:
- If you have spare capacity across the organization but utilization issues within individual roles or resources you may be able to re-assign work between resources to resolve the constraints.
- If you have capacity issues across the whole organization you may need to hire more people, put some work on hold or defer projects.
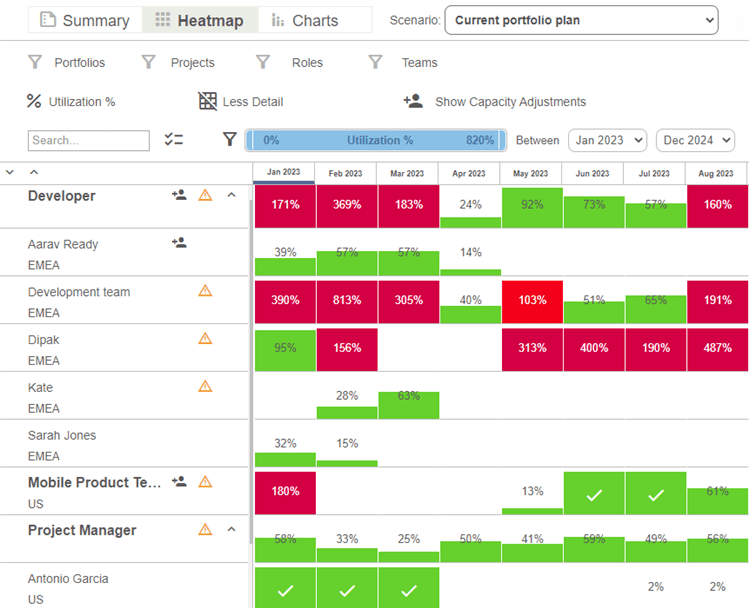
Utilization heatmap
Use the utilization heatmap to understand which roles and resources have too much work (over-allocated) or too little work (under-allocated).

Color coding and the fill level of the cells indicates the relative levels of utilization. The role row is a summary of all work allocated to the resources in the role plus any work assigned to the role itself as a placeholder. Resource rows are a summary of the work assigned to the resource itself.
Reports builder
Kelloo includes an easy to use report builder. Use the report builder to create and generate reports over your Kelloo data. Kelloo ships with default report layouts that you can copy and personalize.
Select reports in the Kelloo main menu to start building reports.
Report data can include:
- Resource capacity, supply and availability
- Resource utilization
- Milestones
- Work assignments
- Labor and non labor costs
Reports can be exported in a variety of formats including pdf, HTML and Excel. Reports can be saved as templates and also shared with your teammates.